Figure 2 represents the Ulysses trajectory during its pole-to-pole
exploration
as the absolute value of the spacecraft's heliographic latitude versus
its heliocentric distance.
One can see that the south path and the north path of the trajectory
are different : Ulysses remains
between 2.31 and 1.34 AU in the southern
hemisphere, and between 1.34 and 2.02 AU in the northern one.
It shows
that the spacecraft
did not sample a given latitude at the same radial distance in
both hemispheres due to a ![]() difference in latitude
between the heliographic equator and the major axis of Ulysses orbital ellipse.
difference in latitude
between the heliographic equator and the major axis of Ulysses orbital ellipse.
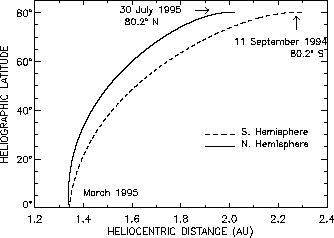
Figure 2: Ulysses trajectory from September 1994 to September 1995.
The heliolatitude modulus is drawn versus the
heliocentric distance, showing the slight trajectory asymmetry between the two
hemispheres.
Figure 3 shows an overview of the QTN observations during the Ulysses pole-to-pole passage. The top panel shows the URAP radio spectrogram, displayed as frequency versus heliolatitude, with intensity indicated by the color bar chart. The intense band which varies from 10 kHz at high latitudes to 10-40 kHz near the solar equator corresponds to quasi-thermal Langmuir waves near the plasma frequency. The high intensity level below 10 kHz corresponds to the proton noise Doppler-shifted by the solar wind speed [Issautier et al., 1996] The bottom panel shows the corresponding electron density and core electron temperature. Figure 3 contains about 170,000 data points obtained with the 128-s time resolution of the URAP low-band radio receiver which is about twice the rate of the on board particle analyzers.
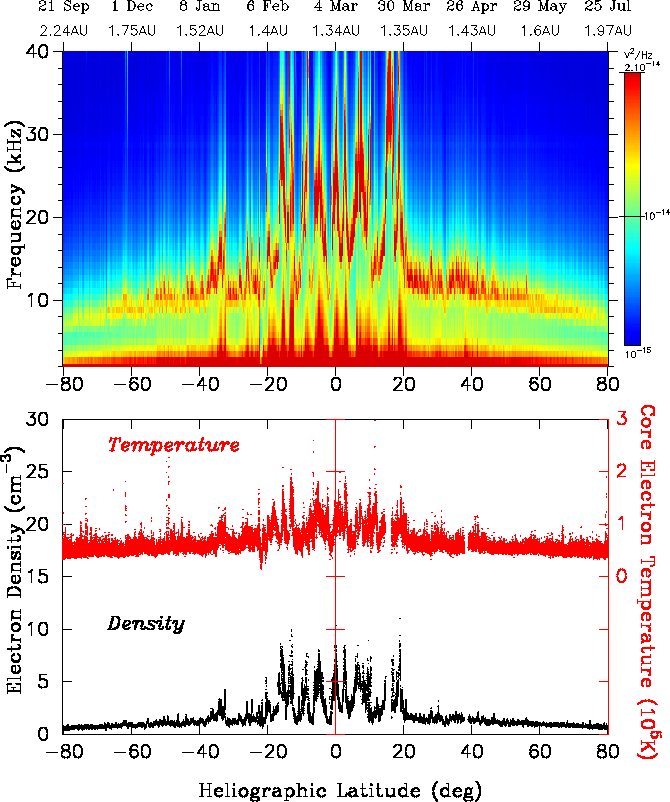
Figure 3: Radio spectrogram from the URAP receiver during Ulysses pole-to-pole
exploration, containing about 170,000 spectra.
The data are plotted as frequency versus heliolatitude, with
the relative intensity ( ![]() ) indicated by the color
bar chart on the right.
The lower panel shows the electron density and
core temperature versus latitude.
) indicated by the color
bar chart on the right.
The lower panel shows the electron density and
core temperature versus latitude.
Figure 3 shows two distinct regions.
In a low latitude
band spanning ![]() S to
S to ![]() N
both the electron density and core temperature have large
fluctuations, as it is also the case for most plasma parameters
obtained on Ulysses (see, e.g., [Phillips et al., 1995a]; [Goldstein et al., 1996]; [Forsyth et al., 1996]).
In this region, Ulysses alternatively encountered slow and fast
speed streams due to its periodic crossings of the warped and tilted
heliospheric current sheet, which is the extension of the coronal equatorial
streamer belt into interplanetary space [Smith et al., 1995]
On the contrary,
at high latitudes, poleward of
N
both the electron density and core temperature have large
fluctuations, as it is also the case for most plasma parameters
obtained on Ulysses (see, e.g., [Phillips et al., 1995a]; [Goldstein et al., 1996]; [Forsyth et al., 1996]).
In this region, Ulysses alternatively encountered slow and fast
speed streams due to its periodic crossings of the warped and tilted
heliospheric current sheet, which is the extension of the coronal equatorial
streamer belt into interplanetary space [Smith et al., 1995]
On the contrary,
at high latitudes, poleward of
![]() S and
S and ![]() N, Ulysses measured the continuous fast solar
wind in a speed range of 700 to 800 km/s [Phillips et al., 1995a]
which originates
from polar coronal holes. In these regions, the nonscaled plasma
parameters shown are very steady, spanning
a density and temperature range of 0.8 to 2.5
N, Ulysses measured the continuous fast solar
wind in a speed range of 700 to 800 km/s [Phillips et al., 1995a]
which originates
from polar coronal holes. In these regions, the nonscaled plasma
parameters shown are very steady, spanning
a density and temperature range of 0.8 to 2.5 ![]() and
and
![]() to
to ![]() K, respectively.
K, respectively.